.pdf
.pdf
Thermoelectric Effects: Peltier Cooling and Thermoelectric Generation
1. Introduction
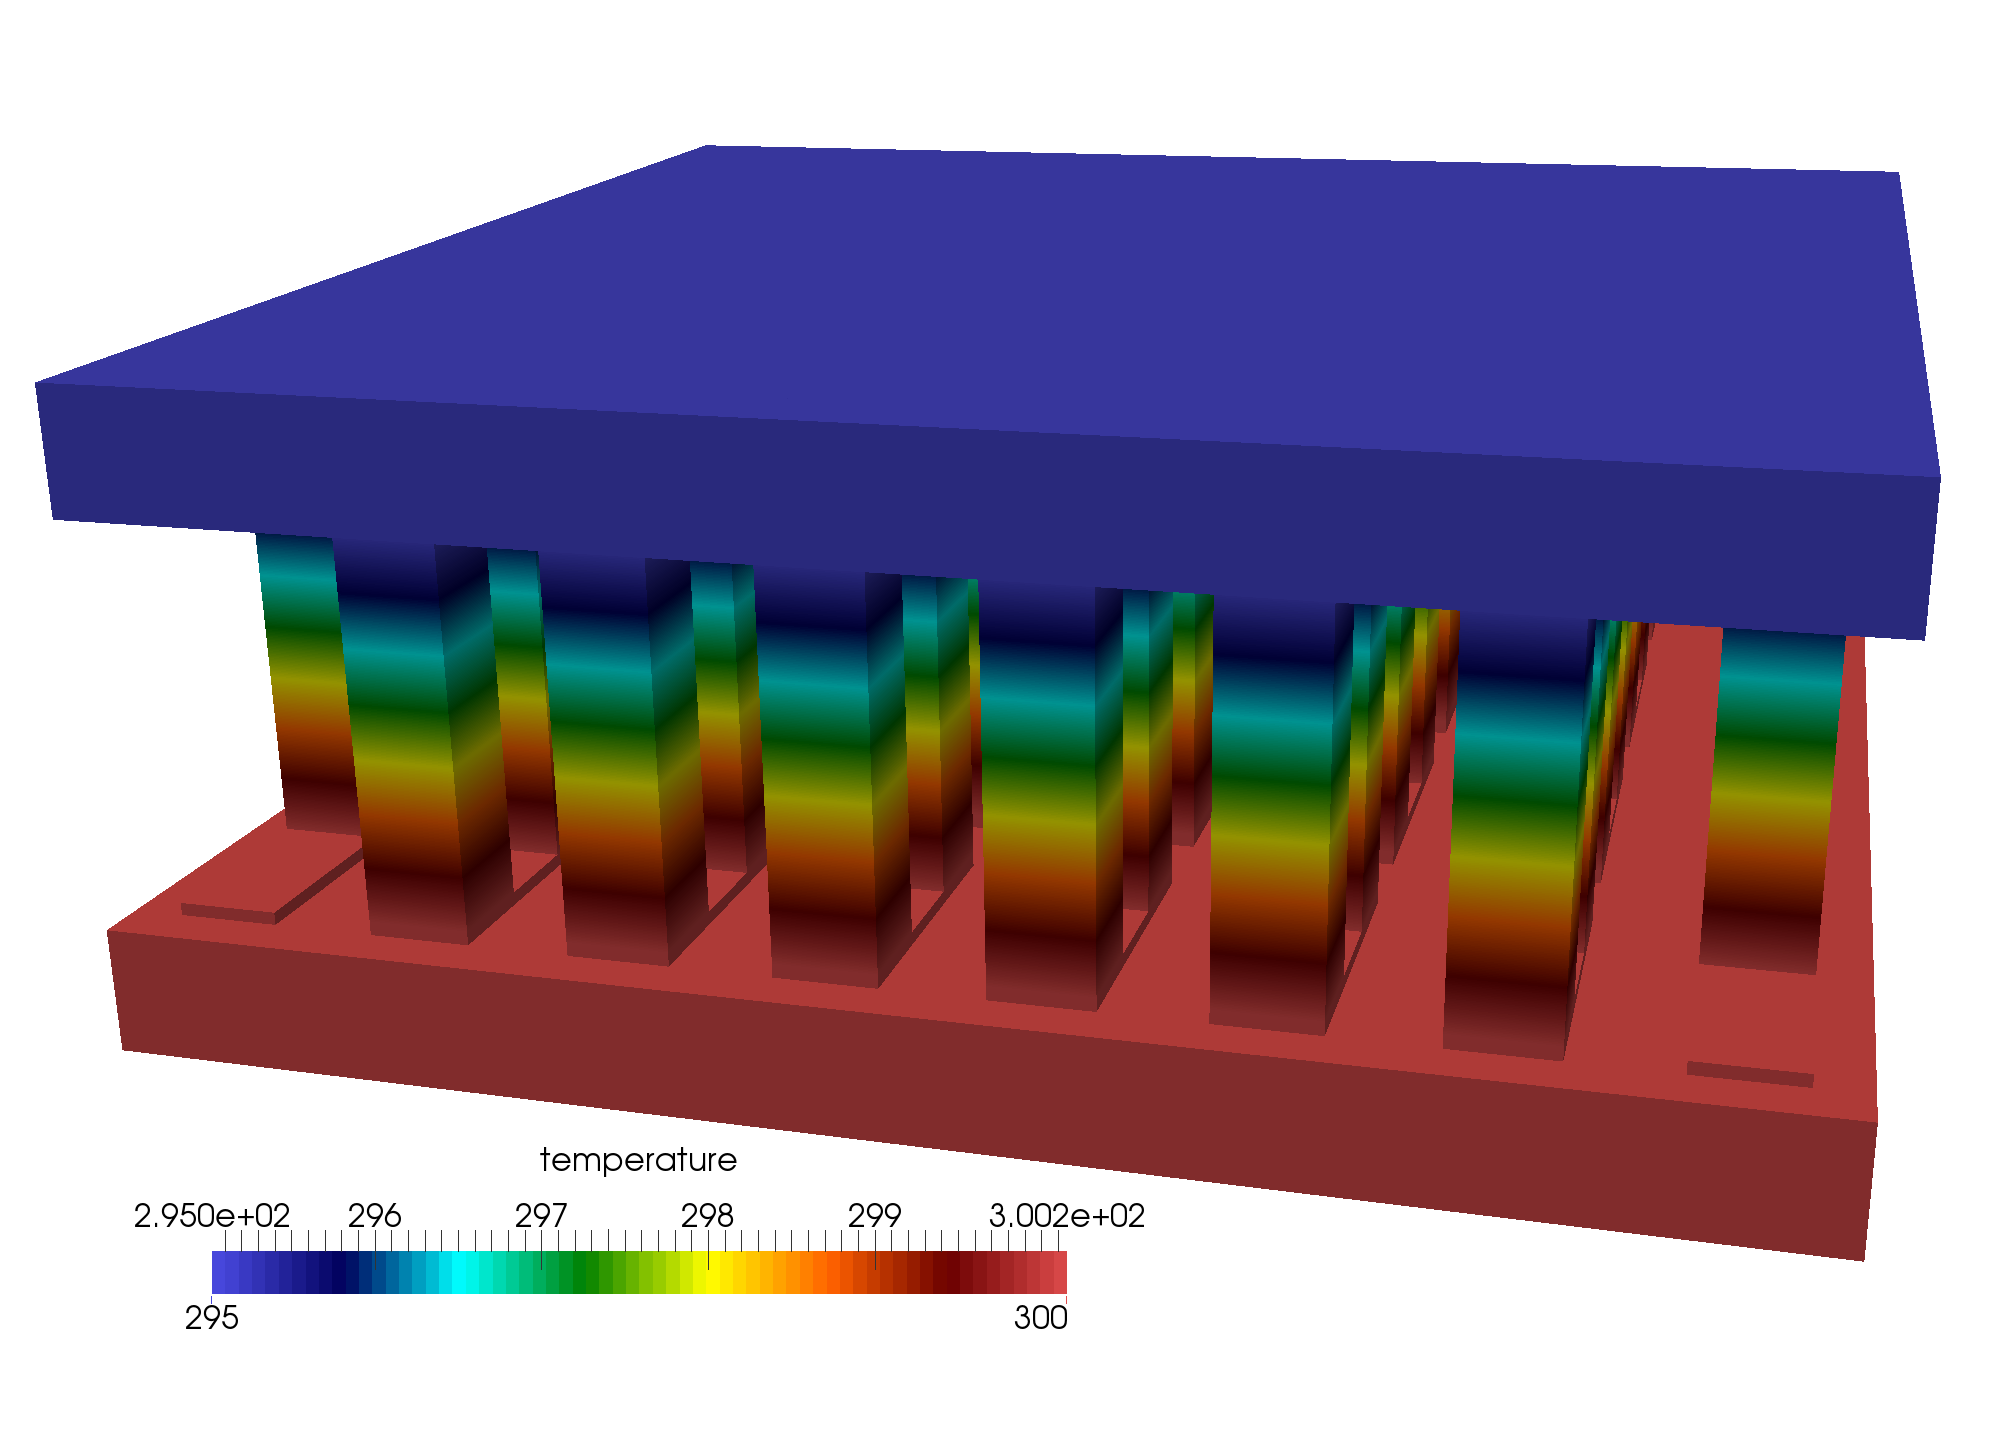
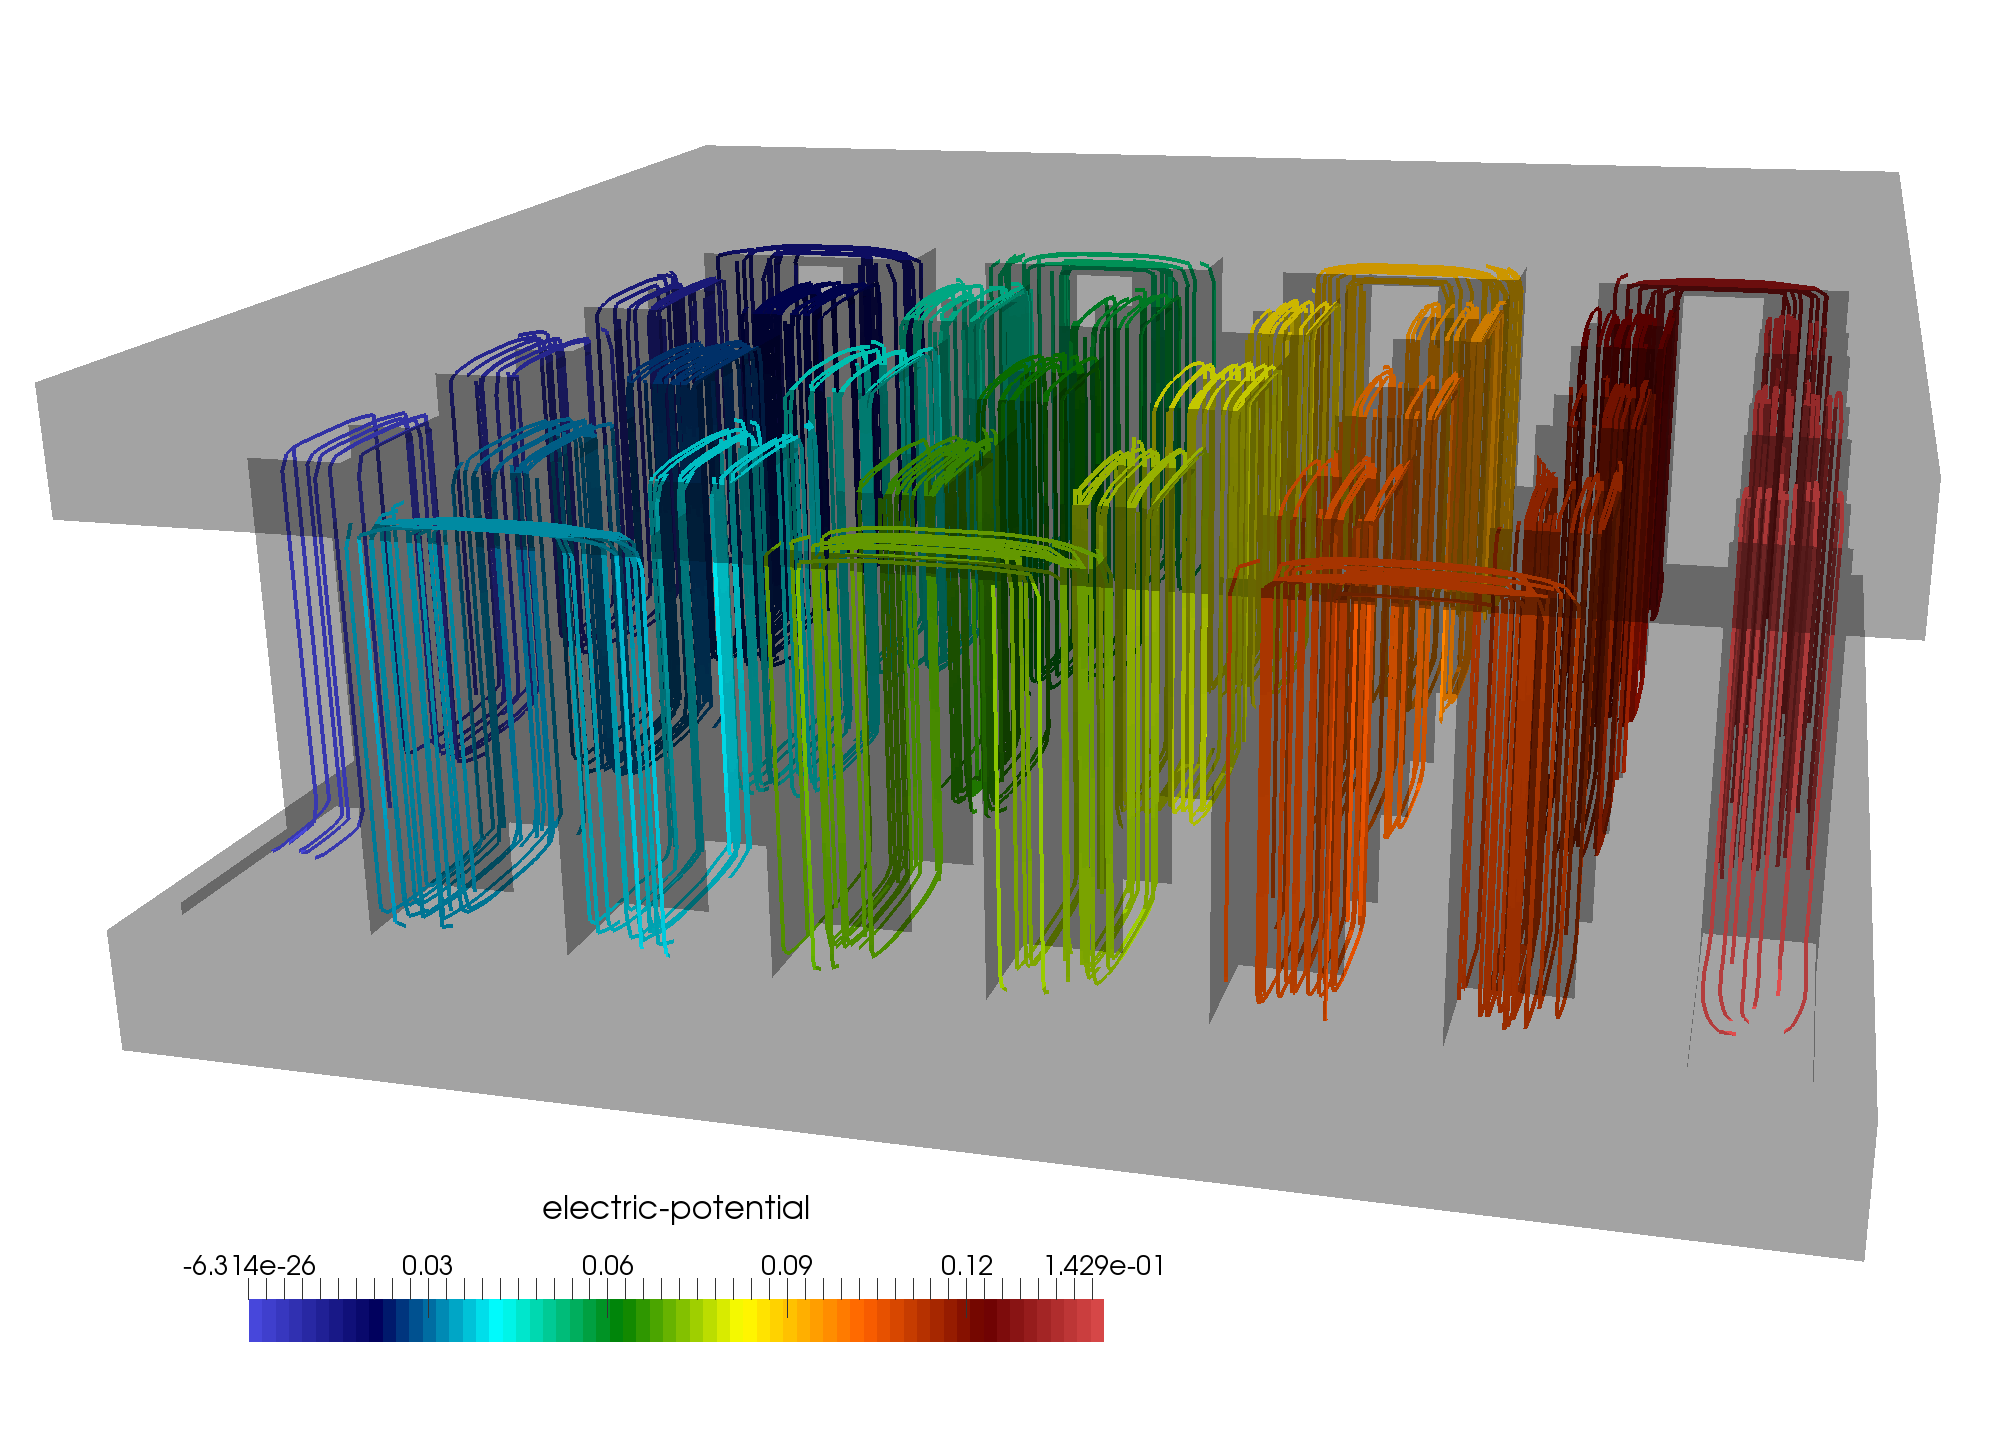
This document describes the mathematical model for the simulation of thermoelectric effects, specifically Peltier cooling and thermoelectric generation. The coupled heat equation and Poisson’s equation are extended to include the thermoelectric effects.
These effects are governed by the following equations:
In these equations:
-
\(T\) is the temperature.
-
\(V\) is the voltage.
-
\(\alpha\) is the thermopower (Seebeck coefficient).
-
\(\sigma\) is the electrical conductivity.
-
\(\lambda\) is the thermal conductivity.
Usually, the properties \(\alpha\), \(\sigma\), and \(\lambda\) may depend on temperature and may be anisotropic. However, in this model, we assume isotropic material properties at constant material parameters.
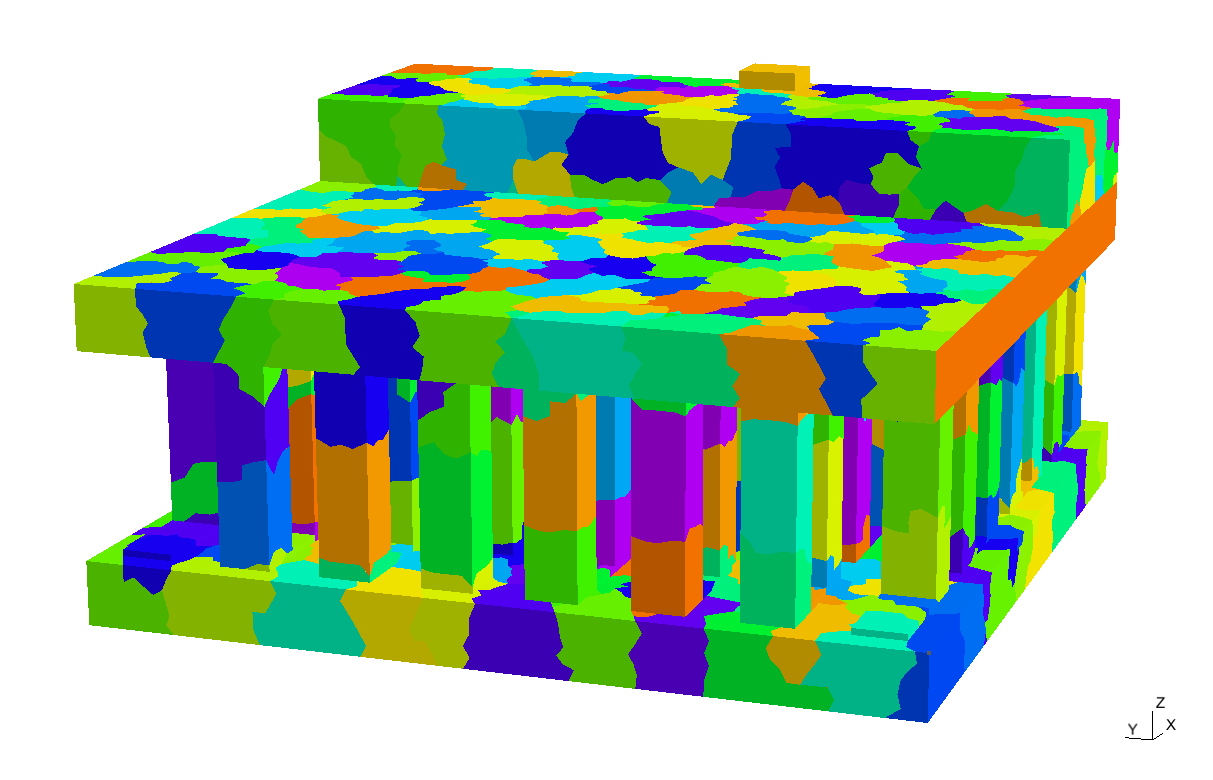
2. Material Properties
Numerical material properties are provided in the following table:
| Symbols | Thermoelectric Material | Electrode (Copper) | |
|---|---|---|---|
Seebeck Coefficient |
\(\alpha\) (V/K) |
p: 200e-6, n:-200e-6 |
6.5e-6 |
Electric Conductivity |
\(\sigma\) (S/m) |
1.1e5 |
5.9e8 |
Thermal Conductivity |
\(\lambda\) (W/m/K) |
1.6 |
350 |
Density |
\(\rho\) (kg/m^3) |
7740 |
8920 |
Heat Capacity |
\(C\) (J/kg/K) |
154.4 |
385 |
These properties will be used in the simulations to model the thermoelectric effects accurately.